
T-Chart Template: Free Printable, 2 or 3 Columns
A T-chart is a graphic organizer that sorts ideas into two columns under headings such as Pros and Cons. Make a free T-chart template with 2 or 3 columns, your own headings and writing lines sized for the child’s grade, then print it or save it as a PDF.
What is a T-chart?
A T-chart is a graphic organizer shaped like a capital T: a heading over each column, a bar under the headings and a line down the middle. Children list ideas under each heading to see two sides of a topic, such as pros and cons, facts and opinions, or needs and wants. A third column adds a third group.
How to make a T-chart
Choose 2 or 3 columns, then type a title, or leave it blank for a Topic line to write on. Type a heading for each column, or leave one blank to write it by hand. Pick the lines and the paper, and add a version for another group. Print the set, or save it as a PDF or PNG.
T-chart examples
-
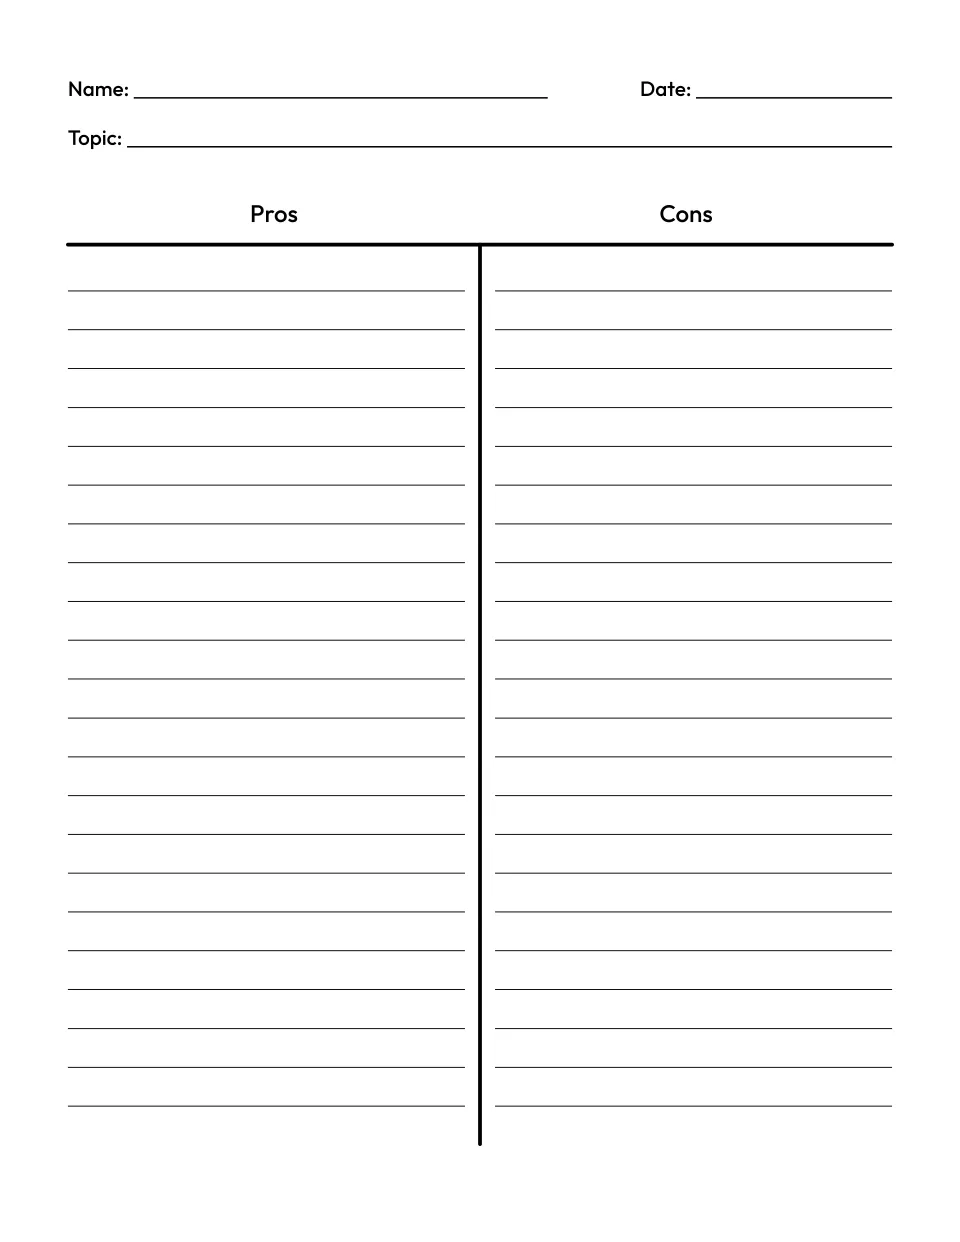
Pros and cons
Customize the pros and cons T-chart template -
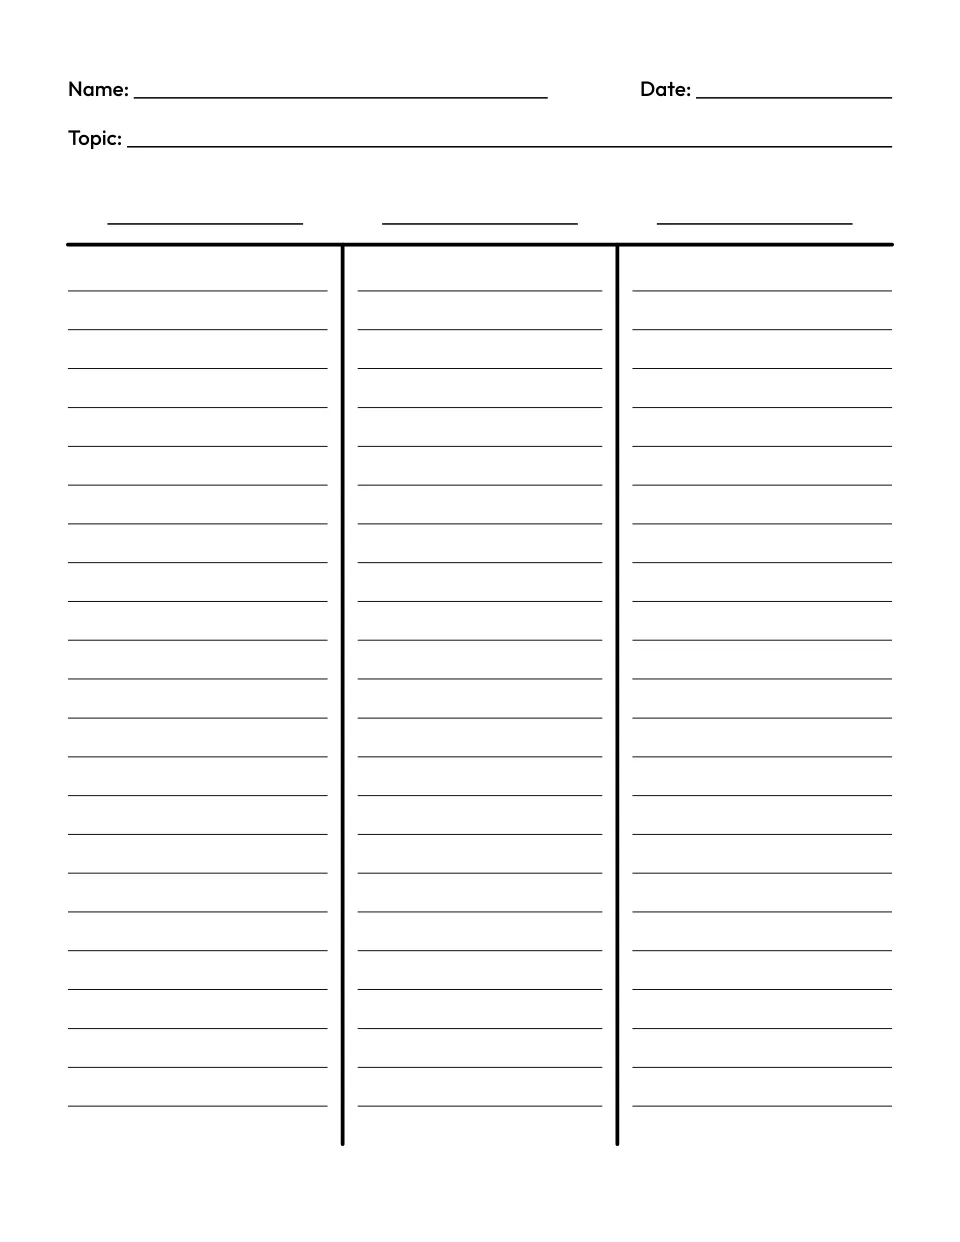
3 columns
Customize the 3 column T-chart template -
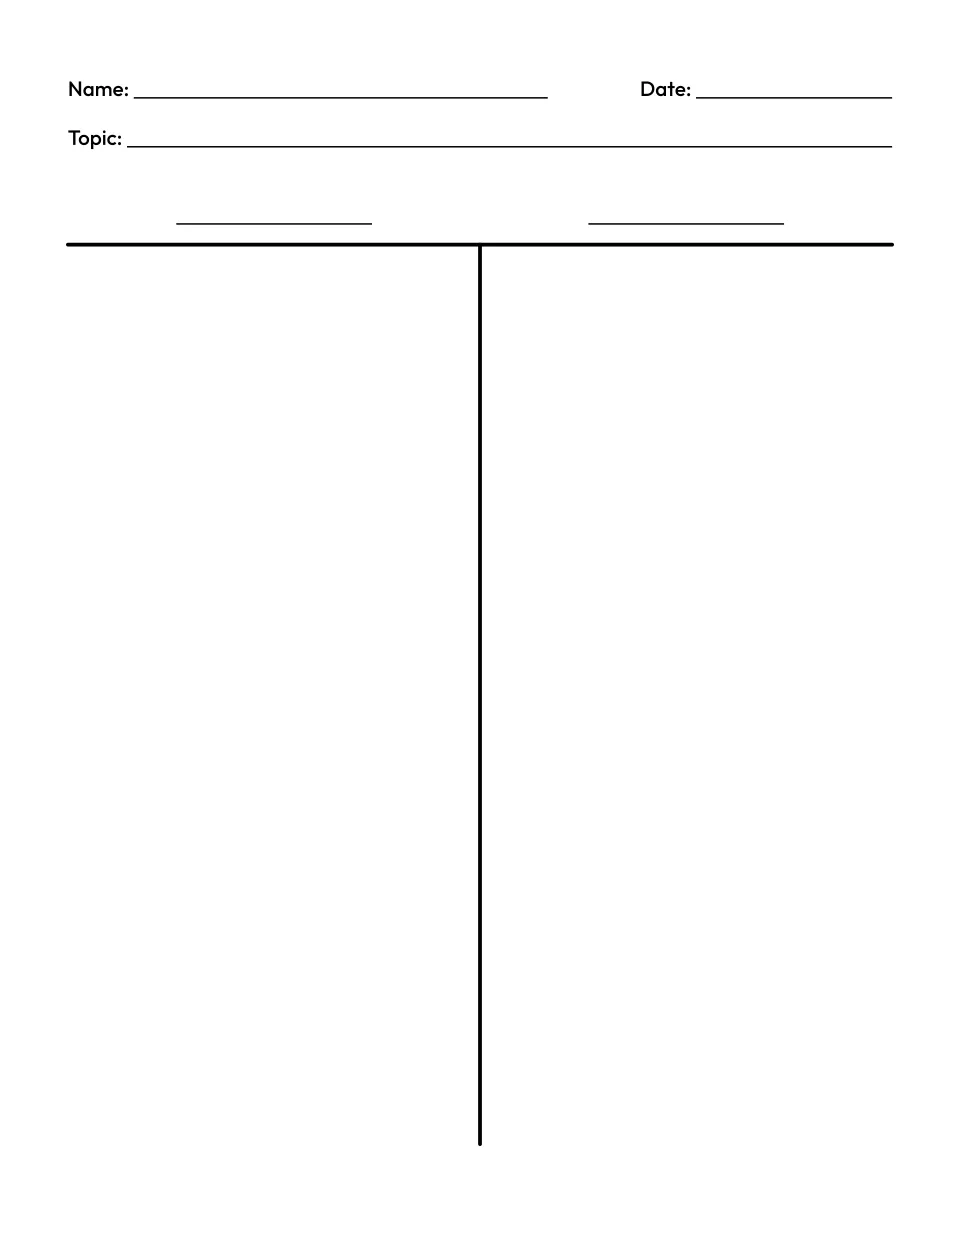
Blank T-chart
Customize the blank T-chart template -
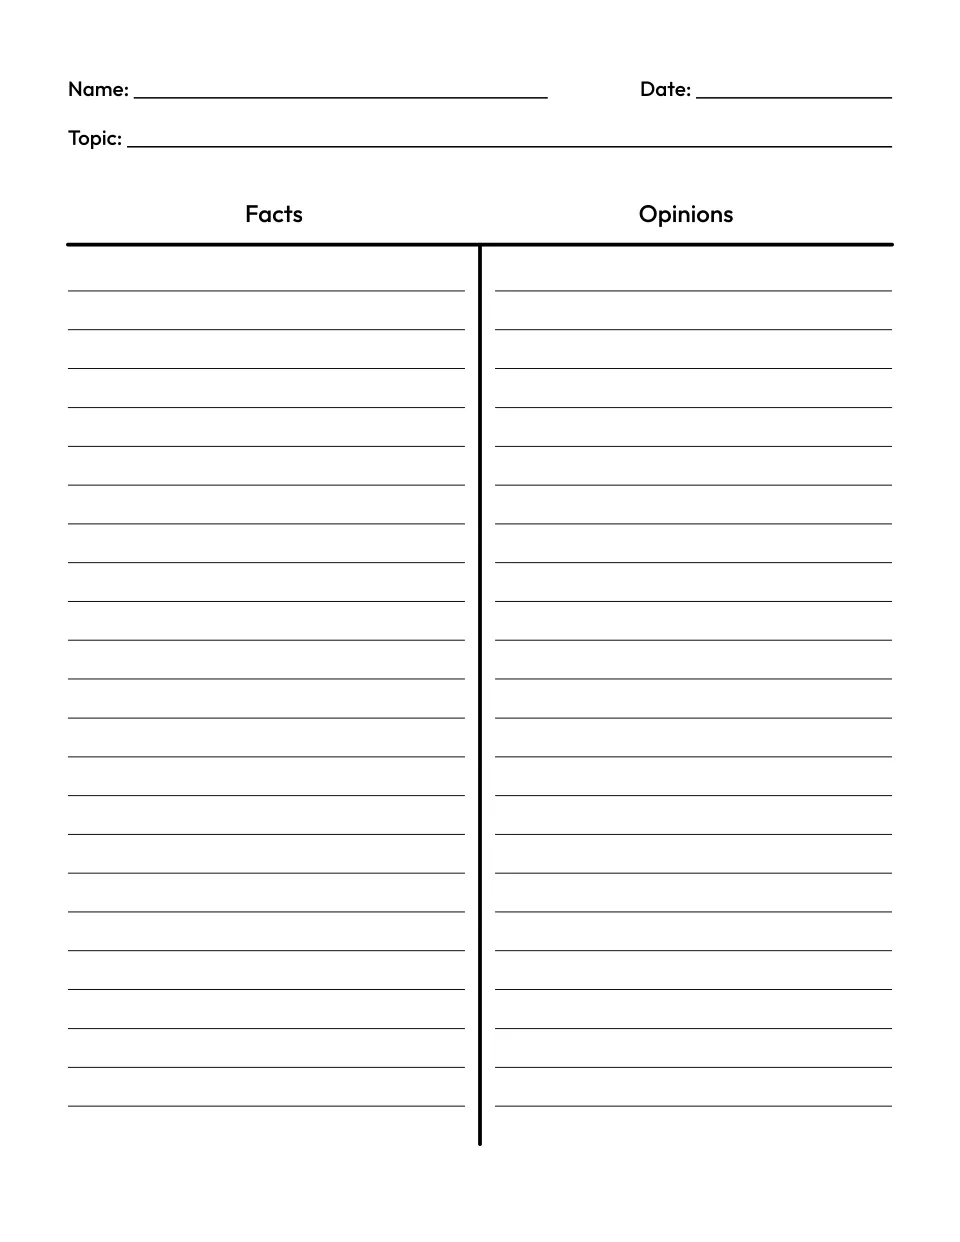
Facts and opinions
Customize the facts and opinions T-chart
The pros and cons chart weighs a choice, such as riding a bicycle to school. Facts and opinions sorts sentences from a nonfiction book into what can be checked and what someone thinks. The 3 column chart adds a third heading, and the blank T-chart leaves room for pictures or sticky notes. For a lesson on money, label the columns Needs and Wants.
Choosing columns and lines by grade
Use 2 columns for two sides of one topic, and 3 when the ideas fall into three groups. For children still learning letter sizes, primary lines give each row a dashed midline, as on our handwriting paper. Older children write on wide or college ruled lines, spaced like our lined paper.
| Lines | Grades | Each column holds |
|---|---|---|
| Primary lines | K to 2 | 8 rows |
| Wide ruled | 3 to 5 | 22 lines |
| College ruled | 6 and up | 28 lines |
| No lines | Any | Blank, for pictures or sticky notes |
What you get
One portrait page on US Letter or A4 with Name and Date lines at the top. A typed title prints as a heading, and a blank one prints a Topic line. Your headings sit over the columns, with a thick bar under them and a line between each column, and a blank heading prints a line to write it on. Every column gets the same writing lines. Print it, or save it as a PDF, or as a PNG for Google Docs and Slides. There is no answer key, since the lists are the child’s own.
Tips for using a T-chart
- One idea per line. Short points are easier to compare across the columns than long sentences.
- Weigh each reason. After a pros and cons chart, have children star the two reasons that matter most before they decide, since a longer column can still lose.
- Ask “How could we check it?” On a facts and opinions chart, a sentence a child could check in another book goes under Facts, and one that tells what someone thinks goes under Opinions.
- Keep the link. Next lesson, open it and change only the headings.
Ready-made printables
For the paragraph that follows a chart, print our lined paper, or handwriting paper with the same primary rows, and find more on our printable paper page. To compare two things that share something, use the Venn diagram template, and to start a new unit, a KWL chart template. Children can sort this week’s words by sound on a T-chart, then practice them with the spelling worksheet generator, or draw a story on a comic strip template. More are on our free printable makers page.
Questions about the T-chart template
Is this T-chart template free?
Yes. The examples above and any T-chart you make here are free, with no sign up and no limit on how many you print. Each chart is drawn in your browser, so nothing you choose is uploaded or stored. The charts are free for personal and classroom use, so you can copy them for a whole class or a homeschool group.
What is a T-chart, and what can you compare on one?
A T-chart is a graphic organizer with a heading over each column, for any topic with two sides to sort. The classic T-chart lists the pros and cons of a choice, such as riding a bicycle to school. In reading, children sort facts and opinions from a nonfiction book, and in a money lesson, needs and wants. A T-chart also sets two things side by side, such as the Sun and the Moon, with a list under each heading. With 3 columns, add a heading for a third group.
Should I use a T-chart or a Venn diagram?
Use a T-chart when the two lists stand apart, such as pros and cons, or facts and opinions. Use a Venn diagram when the two things also have something in common, since its middle holds what is true of both: plants and animals both need water, for example. Our Venn diagram template has the same title, label and line settings, so a class can move from one to the other on the same lines.
How many columns can a T-chart have?
This template prints 2 or 3 columns, each with the same writing lines: 8 primary rows, 22 wide ruled lines or 28 college ruled lines. On a portrait page, a fourth column would be too narrow for a few words on each line, so for four groups, print two charts as versions of one set. Leave a heading blank and it prints a line for children to write their own.
Can I save or share my T-chart?
Yes. Once you change anything, the page address holds your columns, title, headings and lines, so you can bookmark it or send the link to another teacher or parent. Press Add a version for up to six charts, lettered A to F, each with its own headings and line size. Print and PDF then offer every version together or one at a time. Nothing is random, so the link always draws the same charts.
How do I put a T-chart in Google Docs or Slides?
Make the chart here with your title and headings, then press PNG to save it as an image. In Google Docs or Slides, choose Insert > Image > Upload from computer and pick the file. In Slides, a text box in each column lets a student type on screen. For a paper copy, press Print or PDF here instead, so the chart prints at full page size.
Can I print a T-chart from a phone, or on A4?
Yes. The chart maker works in any modern browser on a phone or tablet, with nothing to install. On a small screen your versions sit in a row above the preview, and the settings follow below it. Press PDF to save the chart, or Print to send it to a wireless printer. If your printer takes A4 paper, choose A4 under Paper, and the examples print on A4 too.