
Free Printable Decimal Place Value Chart
Print a free decimal place value chart from the ready-made charts below, or save it as a PDF. Customize your own to tenths, hundredths or thousandths, with whole number columns up to hundred millions and an answer key for worksheets.
Ready-made decimal place value charts
-
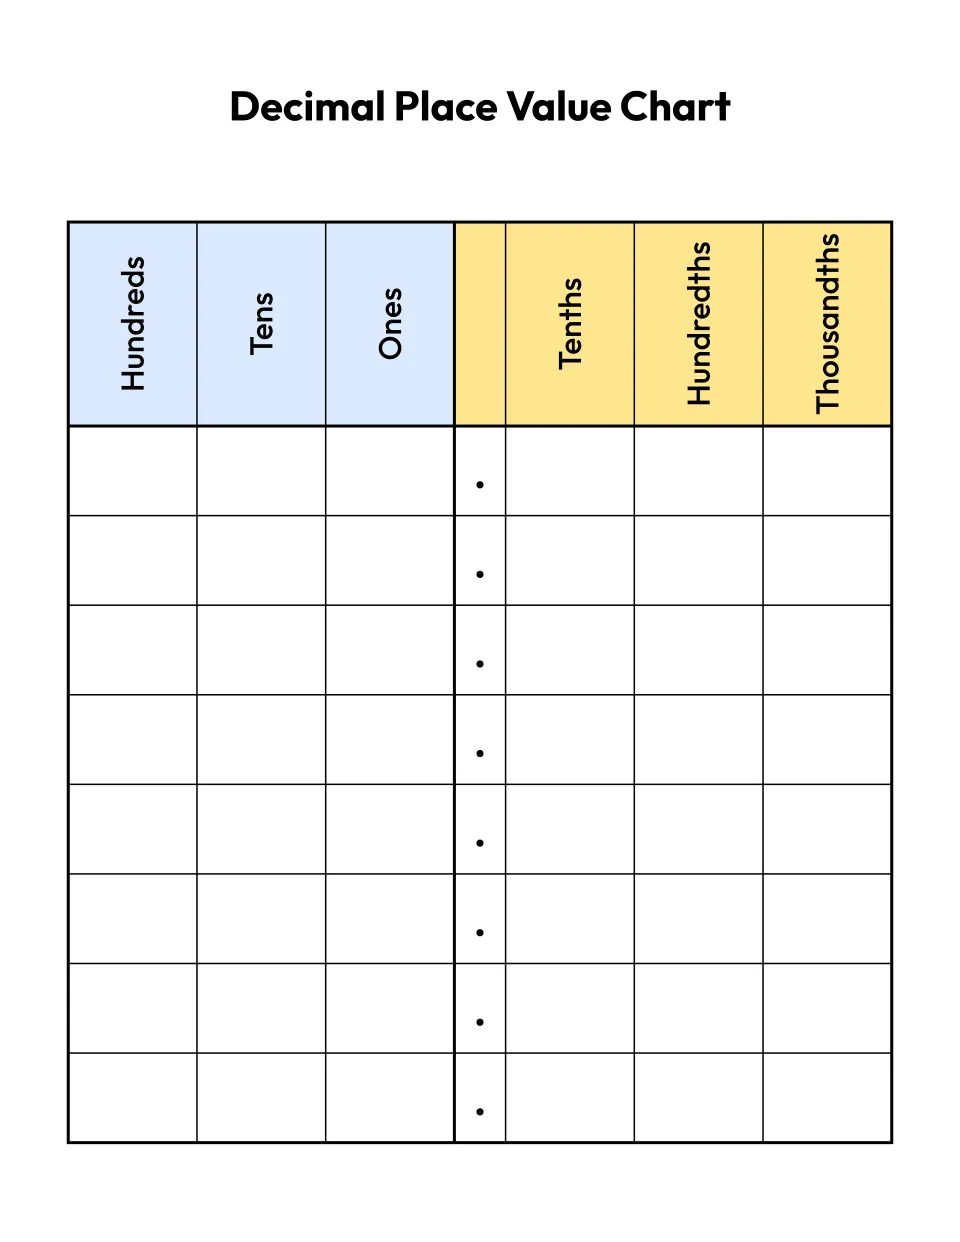
Hundreds to thousandths
Customize the blank decimal place value chart, hundreds to thousandths -
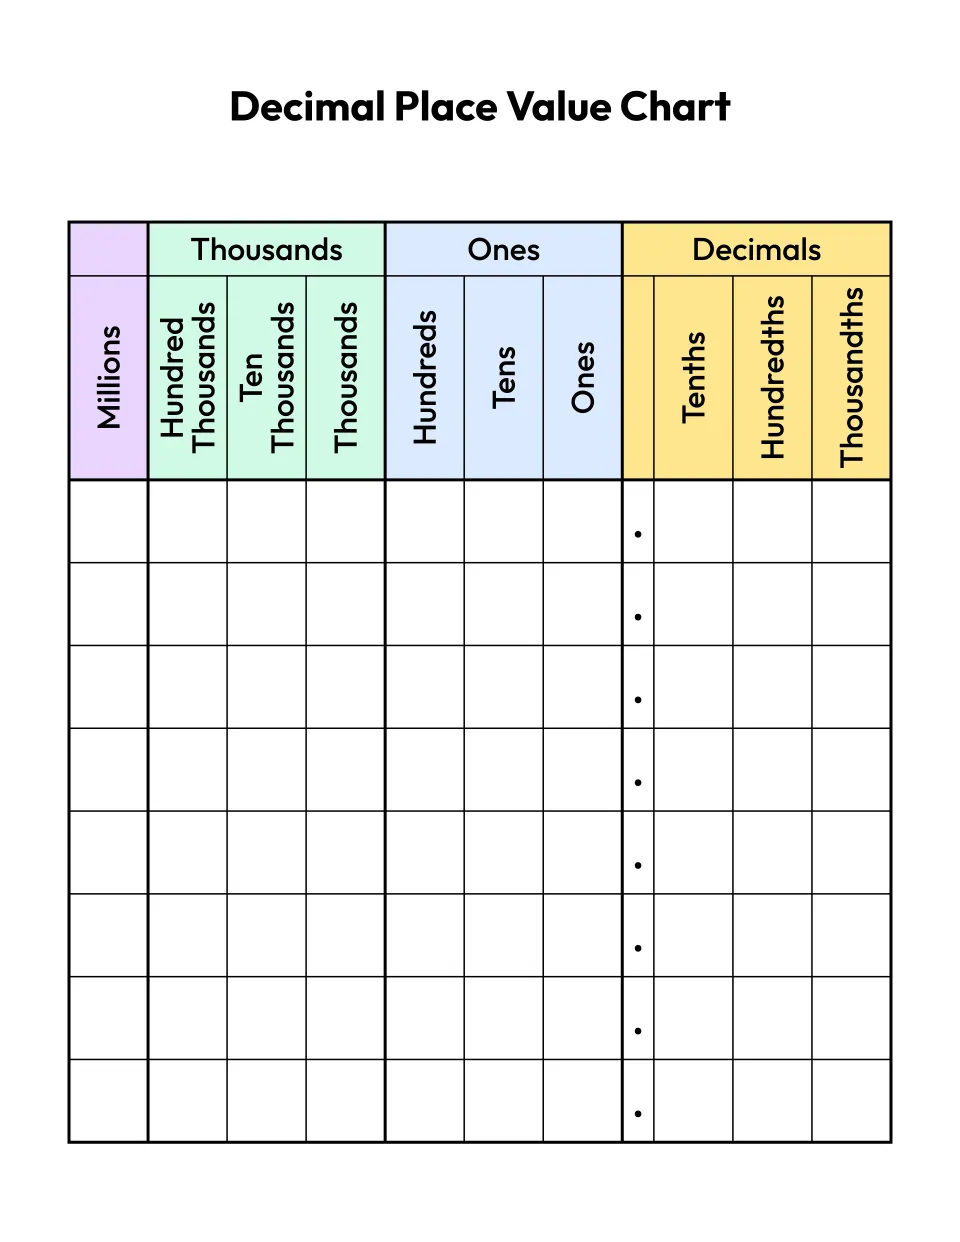
Millions to thousandths
Customize the place value chart with decimals, millions to thousandths -
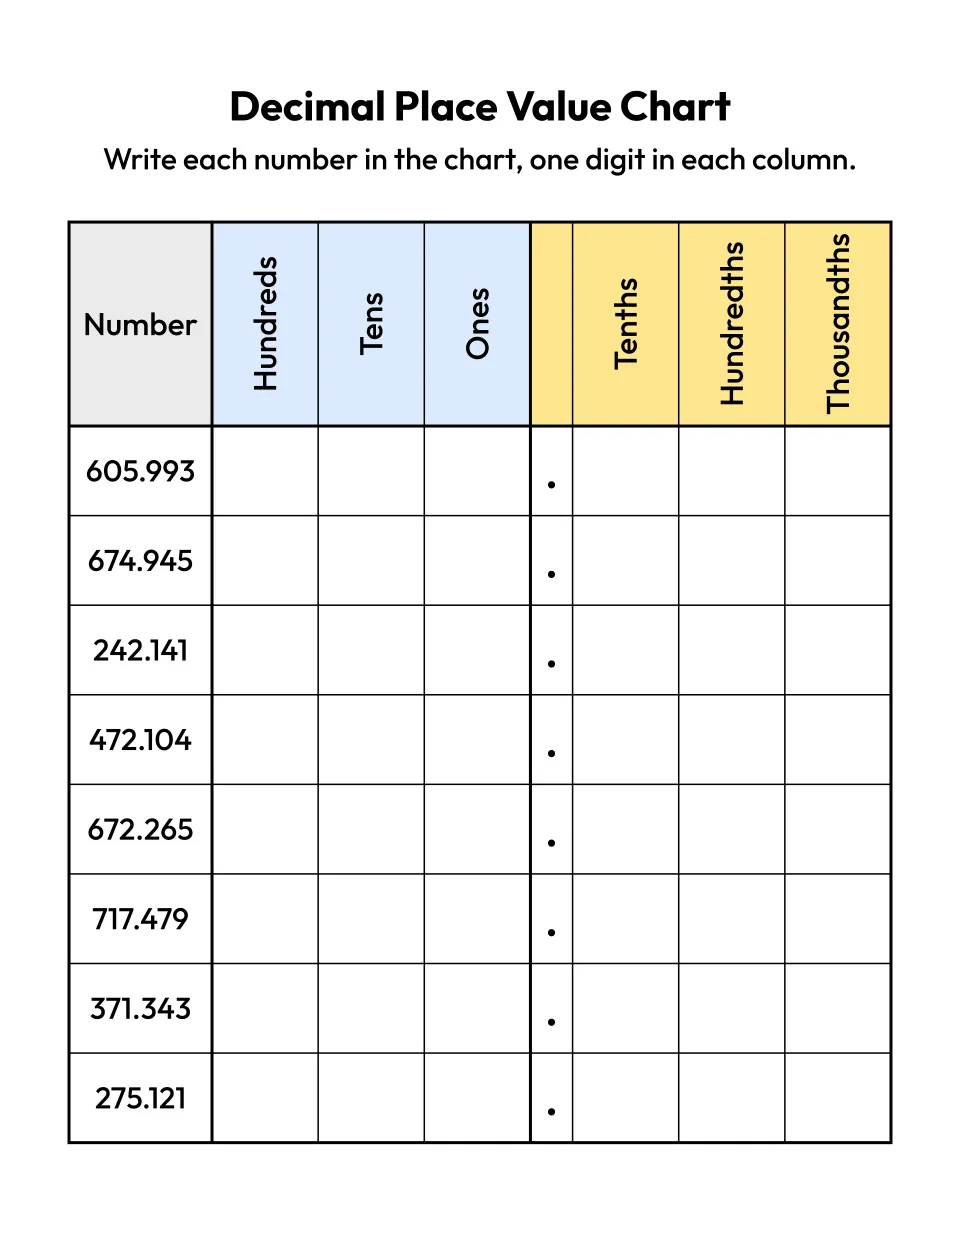
Worksheet
Customize the decimal place value worksheet with answer key -
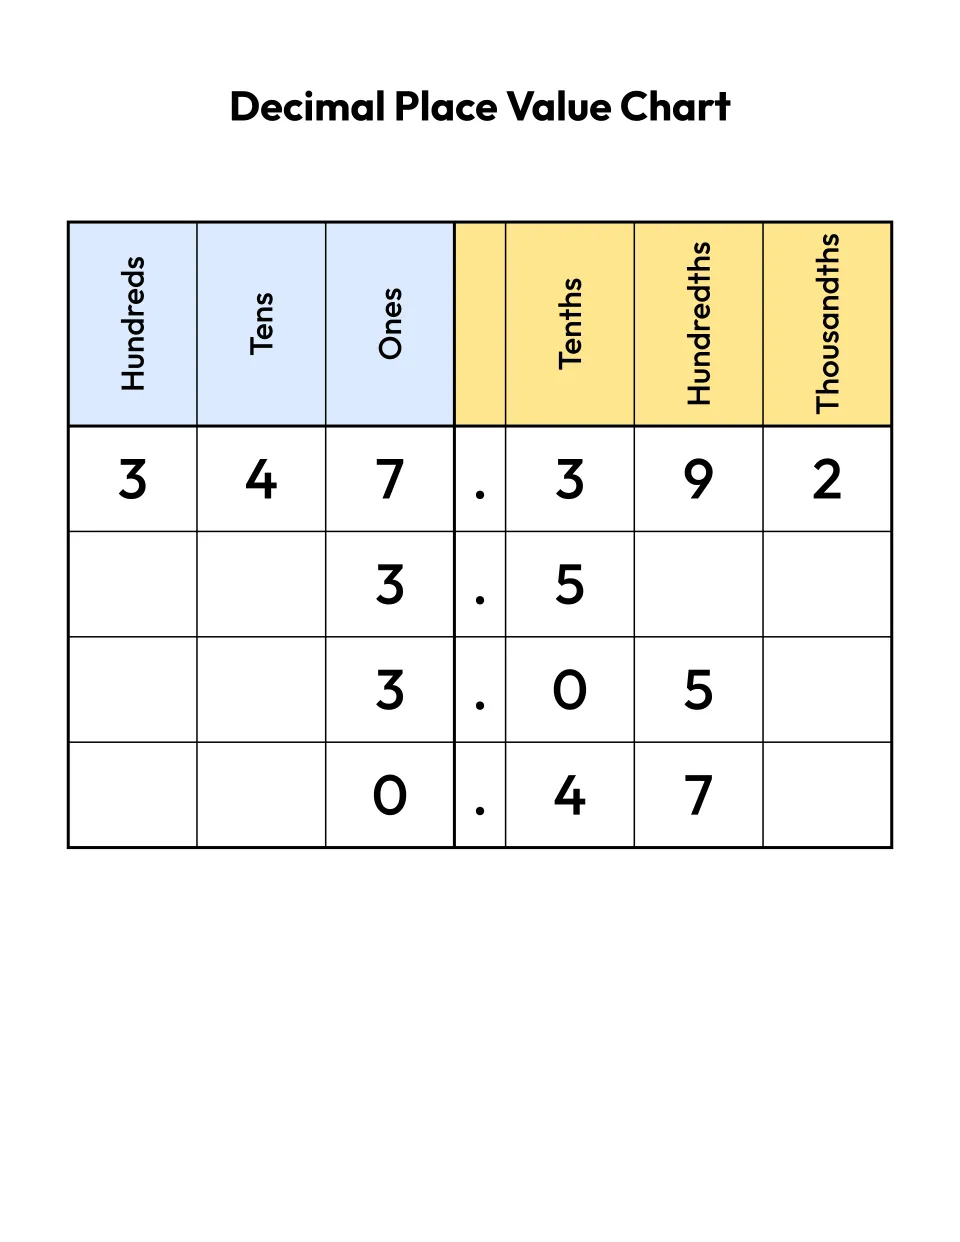
Anchor chart
Customize the decimal place value anchor chart with numbers filled in -
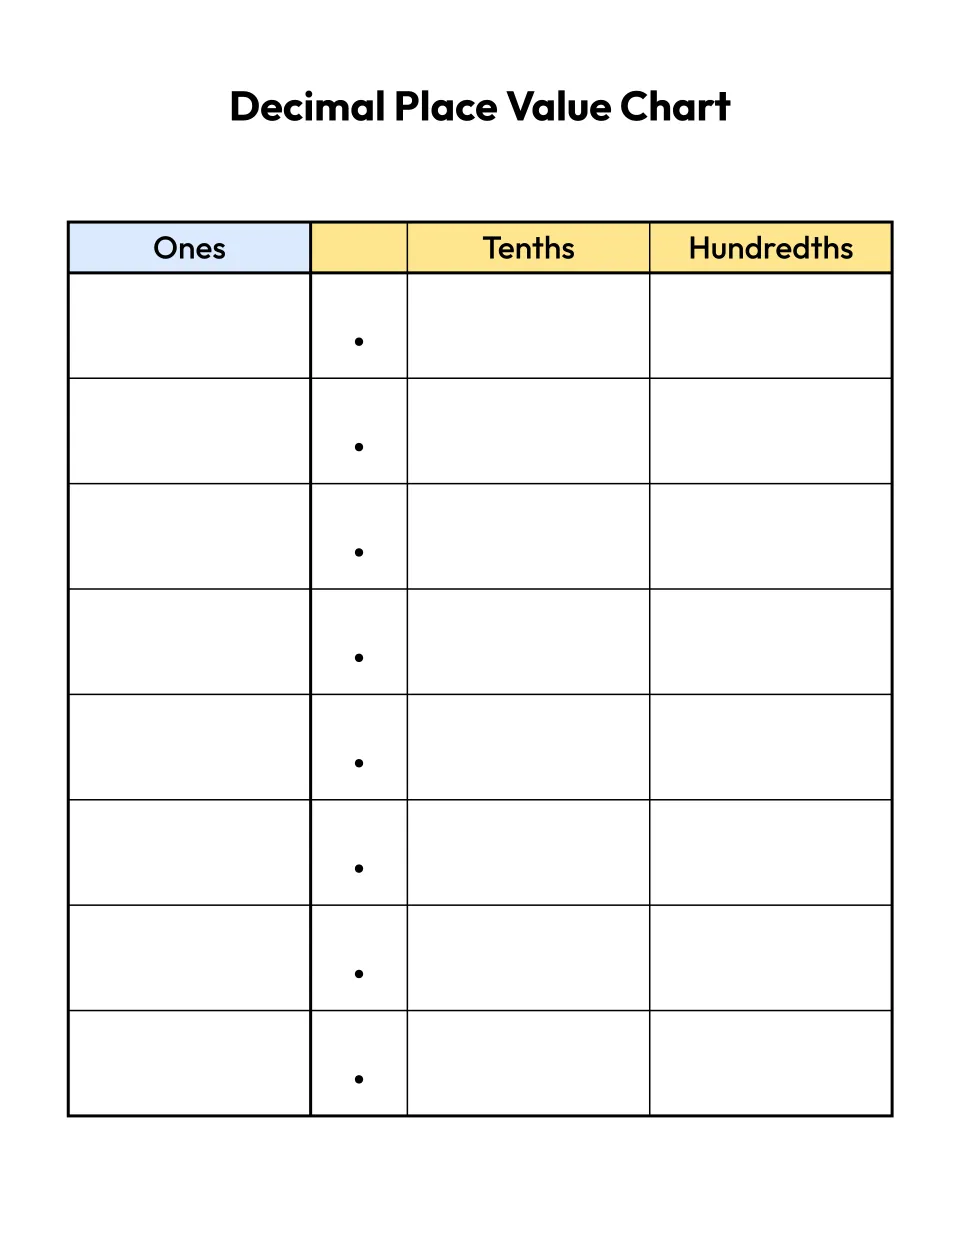
Tenths and hundredths
Customize the tenths and hundredths place value chart
What is a decimal place value chart?
A decimal place value chart is a table with one column for each place in a number. Tenths, hundredths and thousandths, the parts smaller than one, go to the right of the decimal point, which sits in its own narrow column after the ones. Each column is worth one tenth of the column to its left (Common Core 5.NBT.A.1).
Customize your own
How to read a decimal on the chart
Read the whole number part, say “and” at the decimal point, then read the digits after it with the name of the last filled column. 347.392 puts 3 in the hundreds, 4 in the tens and 7 in the ones, then 3 tenths, 9 hundredths and 2 thousandths: three hundred forty-seven and three hundred ninety-two thousandths. Common Core 5.NBT.A.3a writes it in expanded form as 3 × 100 + 4 × 10 + 7 × 1 + 3 × (1/10) + 9 × (1/100) + 2 × (1/1000). In the same way, 0.47 reads as forty-seven hundredths.
Zeros after the point
A zero at the end changes nothing: 3.5 and 3.50 are the same amount, with the 0 written in the hundredths. A zero in the middle holds a place: 3.05 has 0 tenths and 5 hundredths, so it is less than 3.5. The Anchor chart above puts both in one chart, and the tenths column shows which is bigger.
How to make your own decimal place value chart
Under Customize your own, choose the Smallest place (tenths, hundredths or thousandths) and slide Biggest place to the highest whole number column you need. Then pick Blank rows, Numbers in the chart, or Worksheet. Type decimals one per line with a point, or let the page pick them. Choose colors and a paper size, then press Print or PDF.
Choosing columns by grade
| For | Columns | Chart |
|---|---|---|
| Grade 4, US (4.NF.C.6) | Ones to hundredths | Open this chart |
| Grade 5, US (5.NBT.A.3) | Hundreds to thousandths | Open this chart |
| Whole numbers with decimals | Thousands to thousandths | Open this chart |
| Year 6, England (curriculum) | Ten millions to thousandths | Open this chart |
Fourth graders meet tenths and hundredths when Common Core 4.NF.C.6 asks them to “rewrite 0.62 as 62/100.” 5.NBT.A.3 asks fifth graders to “Read, write, and compare decimals to thousandths.” England’s national curriculum asks Year 6 to identify the value of each digit in numbers given to 3 decimal places.
What you get
Each chart fits one US Letter or A4 page, with up to 12 rows. The point column prints a dot in every row, lined up with the digits, so a child writes the whole number to its left and the decimal part to its right. In color, the decimal places have pale yellow headers and the ones, tens and hundreds pale blue, with green for thousands and purple for millions. Black and white uses light grey. Worksheets add the answer key on page 2, and their random decimals fill every column. For a class, Add a version makes up to six charts, lettered A to F, each with decimals of its own.
Tips for teaching decimals
- Compare in one chart. Type your own decimals, such as 0.5, 0.45 and 0.405, and compare them column by column from the left.
- Start with two places. The Tenths and hundredths chart keeps the columns wide while children meet tenths and hundredths.
- Add whole number columns when the numbers grow. Slide Biggest place to Thousands for numbers such as 1,250.375.
More math printables
For whole numbers from tens and ones up to hundred millions, print a place value chart. The printable multiplication chart page prints times tables up to 20, and a hundreds chart helps younger children count. To draw your own tables, print graph paper, and for number puzzles, sudoku for kids. More makers are on our free printable makers page.
Questions about the decimal place value chart
Are these decimal place value charts free to print?
Yes. Every chart on this page is free, with no sign up and no limit on how many you print. Each chart is drawn in your browser, so the decimals you type are never uploaded. The charts are free for personal and classroom use, so print a copy for every child in the class or a stack for your homeschool group.
Does the decimal place value worksheet come with an answer key?
Yes. The Worksheet chart above, and any chart set to Worksheet under Customize your own, puts the key on page 2 of the PDF, with each decimal’s digits written into the chart in bold and the point lined up in its column. Print prints both pages. A blank chart, or one with the decimals already in it, has no key, and PNG saves page 1 only.
Why does the decimal chart stop at thousandths?
Common Core 5.NBT.A.3 asks fifth graders to “Read, write, and compare decimals to thousandths,” and England’s Year 6 works with numbers to 3 decimal places, so thousandths covers both. A decimal with more places after the point, such as 0.4725, shows a message saying the chart goes down to thousandths instead of printing a cut-off chart.
Is there a place value chart with decimals and whole numbers?
Yes. The Millions to thousandths chart above puts millions, thousands and ones to the left of the point, under bands that name the Thousands, Ones and Decimals groups. To choose your own range, slide Biggest place under Customize your own to any place from Ones up to Hundred Millions. Thousands to thousandths fits numbers such as 1,250.375.
Do I type a point or a comma for decimals?
Type a point: 0.47, not 0,47. Commas only separate groups of three digits in the whole number part, as in 1,250.375. If you type 3,5 the page asks for 3.5 instead of guessing, and it reads 3,500 as three thousand five hundred, which needs a Thousands column. Type one number per line, up to 12.
Can I save or share a decimal place value chart?
Yes. Once you change a setting under Customize your own, the page address holds every version with its columns, chart type, decimals and colors, and the paper size, so you can bookmark it or send the link to another parent or teacher. Opening it draws the same charts, random decimals included.
Can I print a decimal place value chart from a phone, or on A4 paper?
Yes. Tap PDF under any chart to save it to your phone or tablet, or Print to send it to a wireless printer. If your printer takes A4, choose A4 under Paper in Customize your own, and both the ready-made charts and your own print on A4 instead of US Letter.